Debugging Mastery: The Ultimate Guide On Fixing Bugs
A comprehensive article about different strategies and tools for finding and fixing bugs related to software behaviour, performance, security


Table of contents
- About Me 😁
- What is a bug? 🐞
- What are the different types of bugs? 🐌
- What is debugging? 💻
- 3 Powerful debugging strategies in general programming 🦖
- Debugging for web developers 🐘
- Tools for debugging web applications 🔧
- Writing test cases to prevent or fix bugs 💡
- BONUS: Debugging for Android App Developers! 😋
- Summary 🍧
- Resources 🔗
- What's Next? 📒
- Thanks 😇
Whether you are a front-end developer or a back-end developer, this article covers everything you need to know to be able to fix 99% of bugs on your own no matter how difficult they are!
In this article, you will learn about:
Bugs and their different types
What is Debugging?
3 Powerful debugging strategies
Debugging for web developers
Using Chrome Developer Tools to debug unresponsive layouts, network calls, and memory leaks related bugs
Using VSCode Debugger to find bugs within code
Using OWASP ZAP to scan a website for security-related vulnerabilities/bugs that a hacker might use to hack into your website
Writing Test Cases in web applications to prevent or discover potential bugs
BONUS: Debugging for Android App Developers!
And a lot of other stuff!
Additionally, I have also provided external links to some complex keywords and some learning resources which you can find at the bottom of this article. You can use those resources to master all the tools and strategies discussed in this article!
About Me 😁
I am Ishant, a computer science engineering student from India. I have been exploring the field of programming for the past 7 years and throughout my journey, I have dealt with countless number of bugs related to software behaviour, performance, deployment, security etc.
And through this article, I want to share some of the debugging strategies and tools I have learned so far which will surely help you fix almost all of your bugs :)
What is a bug? 🐞

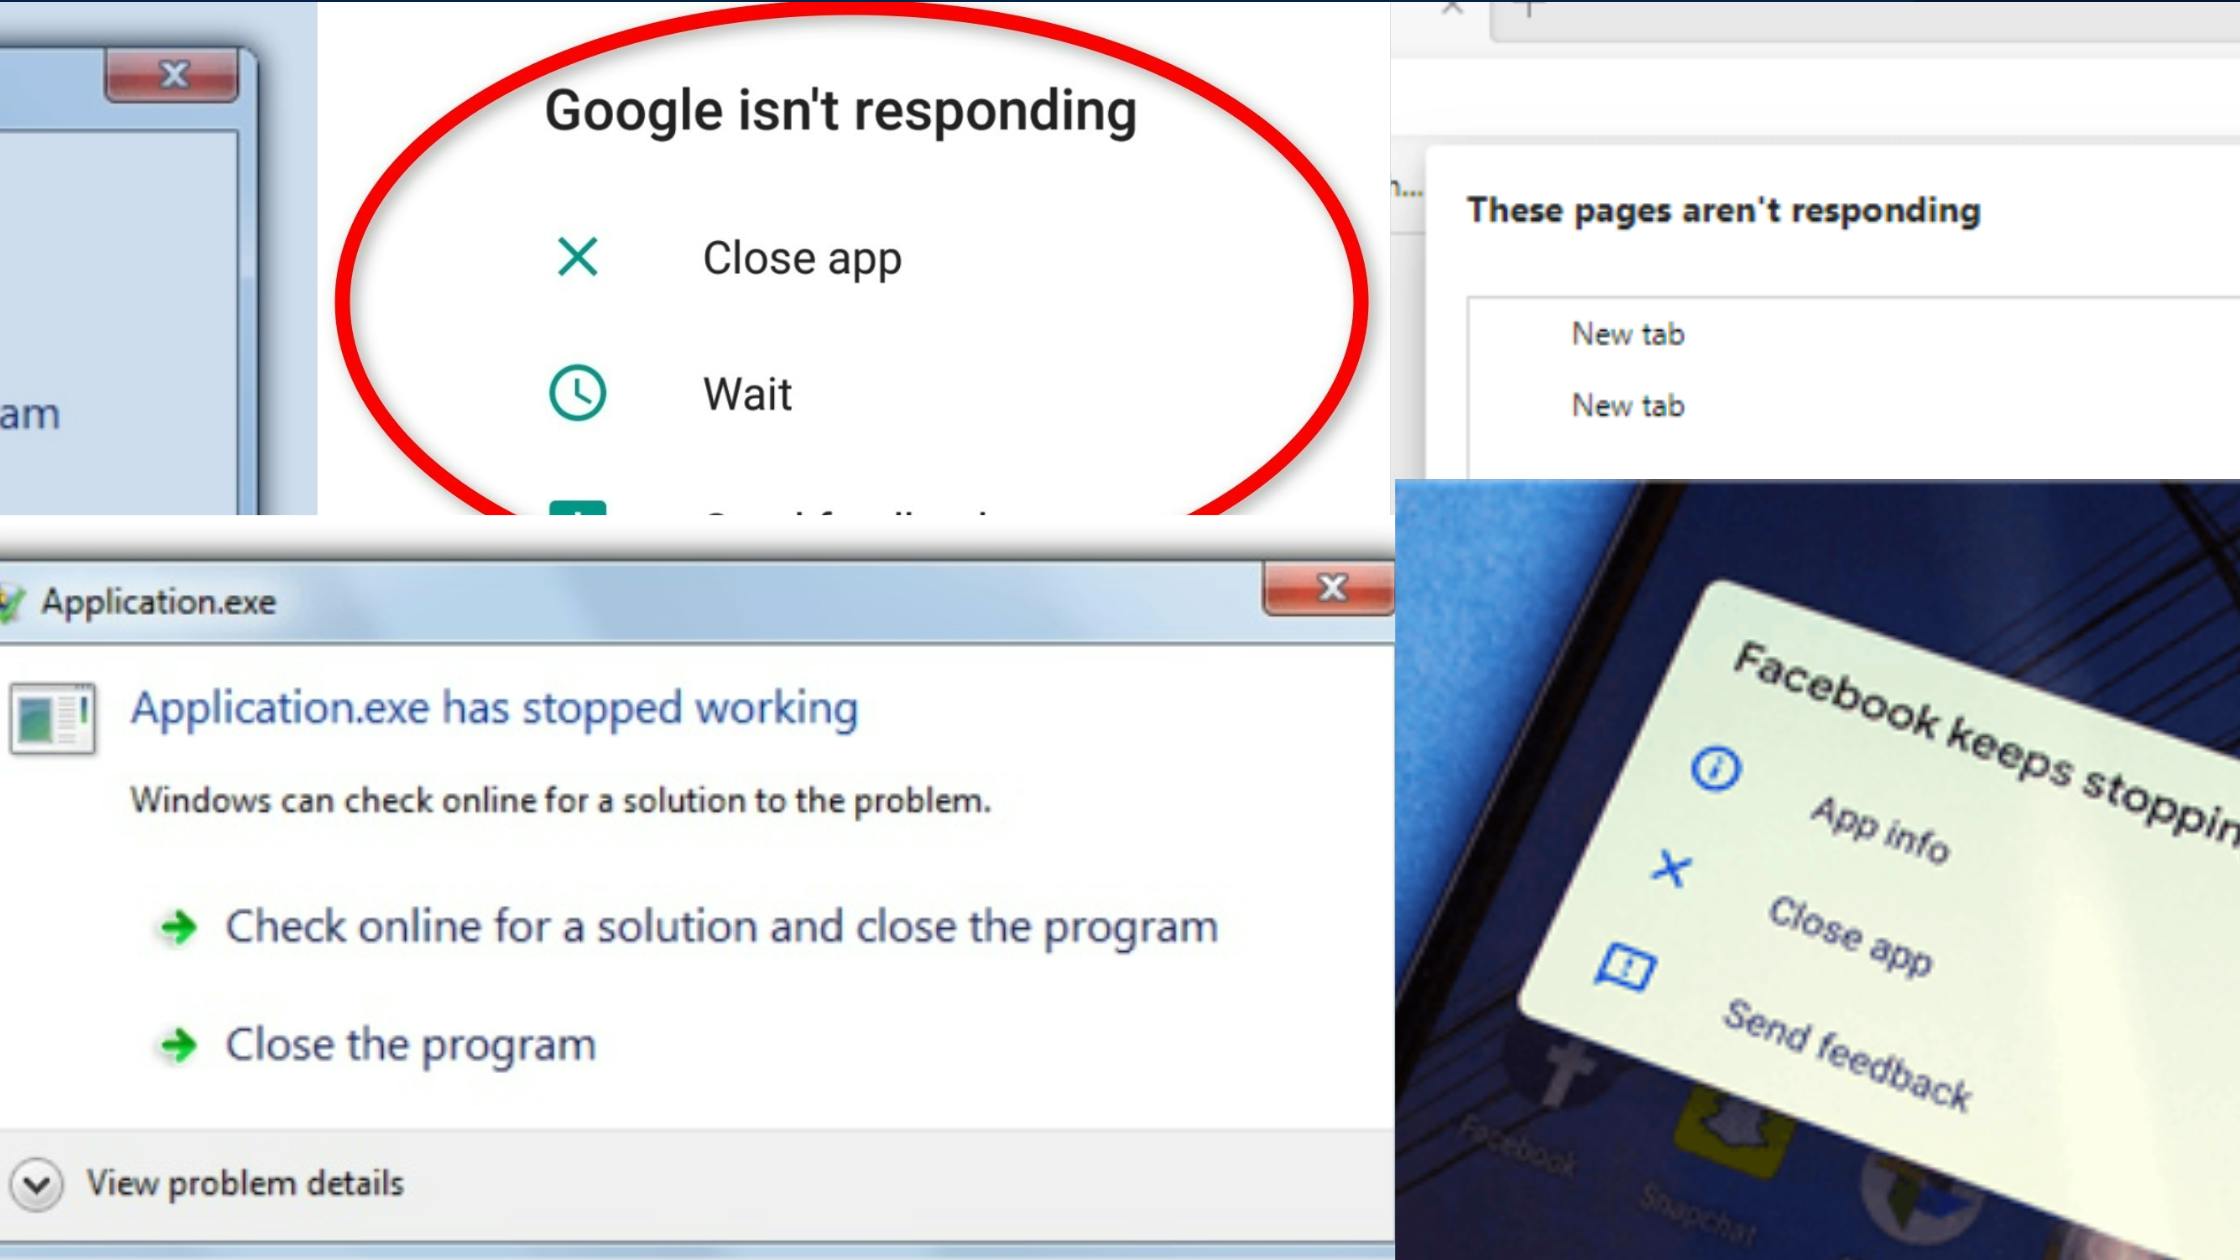
A bug is any unexpected behaviour shown by software that is caused due to an error made by a programmer while writing code.
Some cloud file-handling apps stop responding or crash during slow internet connection. Or if you are a video game lover, you might have experienced a moment where you are driving a car and suddenly the car falls under the terrain as shown in the above image. These are some common real-life examples of bugs!
What are the different types of bugs? 🐌
Different people classify bugs differently. However, for the sake of simplicity, these are some common types of bugs that you will frequently experience
Syntactical Bugs: These are bugs caused due to any spelling mistake when writing code. For example, forgetting a semicolon or a closing bracket. They are the easiest to fix!
Logical Bugs: These bugs are caused due to any logical mistake in code. For example, using incorrect value of pi when writing code to calculate the volume of a cylinder. Such errors can be fixed using a debugger!
Concurrent Bugs: These bugs occur when writing asynchronous code. Asynchronous or concurrent code means when 2 or more tasks run at the same time. For instance, you can call someone on WhatsApp and at the same time chat with some other person. This is an example of concurrency. Suppose 2 tasks A and B are running in parallel. Task A will be executed when B is completed and B will be executed when A is completed. This situation will result in a deadlock where the software may freeze. These bugs can be prevented by making use of promises or callbacks!
Performance Bugs: These bugs happen when your app or software takes too long to open or your website takes too long to load. Such can be fixed using a profiler.
Security Bugs: These bugs happen due to any security vulnerability like SQL Injection or cross-site scripting in your app. There are different tools like OWASP ZAP to discover security bugs in an application.
What is debugging? 💻
The process of finding and removing bugs in software is called debugging. Debugging is a vast subject and an entire book can be written on it so it is not possible to explain everything in a single article
Moreover, debugging also differs based on the programming framework or technology. For instance, debugging a web application is different from debugging a 3D game made in the unreal engine
Therefore in this article, I will primarily talk about debugging web and android applications in the upcoming sections
3 Powerful debugging strategies in general programming 🦖
These are some pretty well know strategies that are often underestimated by new programmers. You can apply these strategies to any programming language, framework or library! Trust me, these strategies or techniques will solve most of your errors if you master them!
#1 Smart Googling
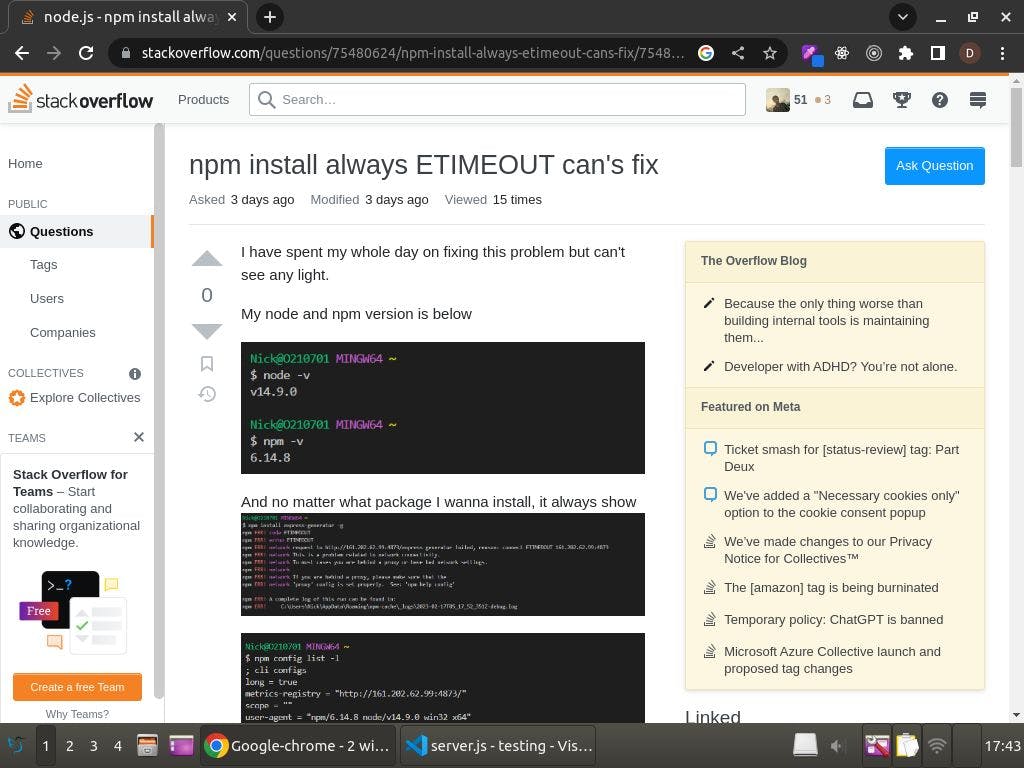
The solution for 99% of your bugs can be easily found on google if you know how to efficiently search! So,
Stackoverflow website contains solutions to millions of bugs. Simply paste the error message in google's search bar and you will get the stackoverflow links with solutions. Also, never forget to check the comment section of stackoverflow as sometimes they can be useful too!
If you are using any third-party package like the material date picker library in ReactJS or mongoose library in NodeJS and are facing any weird bug, you can check their GitHub repository's issues section. Many third-party libraries contain bugs. If those libraries are less popular, chances are that you might not find their solution on StackOverflow. In this case, you can search for or even raise an issue in the GitHub repository or that package.
If you still can't find the solution to your bug, you can try the following generic solutions that will help you in fixing your bugs
#2 Generic Solutions
These are some generic or universal solutions that might solve weird or unknown bugs in your software
Clear cache and restart your code editor, IDE or browser
Reinstall, Upgrade or downgrade versions of dependencies or libraries you are using. Also, ensure that all of them are compatible with each other. For instance, a too older version of NodeJs may not work with the latest version of npm
#3 Hit And Trial Solutions
Here we make an educated guess on what portion of the code might be responsible for the bug
Remove or comment down the different portions of code you think might be responsible for the bug and then re-run the project to see if the bug goes away. This hit-and-trial approach has helped me many times in fixing tricky bugs
If you are still unable to fix your bugs and you can't find any solution on the internet, it means you have to manually dive deeper into the code and find the root cause of the bug. For this, I have explained several debugging tools in the upcoming sections of this article!
Debugging for web developers 🐘
A bug in a web application can arise from the front end or back end. When a bug arises from the front end, it can result in the improper display of layouts, unresponsive experiences etc whereas when a bug arises from the back end, it can result in slow loading of the website, incorrect data being stored in the database etc.
Tools for debugging web applications 🔧
To find the bugs in a web application, there are many choices available. These include the browser's inbuilt developer tools, browser extensions, IDE plugins, dedicated software etc. Some of them are discussed below:
#1 Chrome Developer Tools
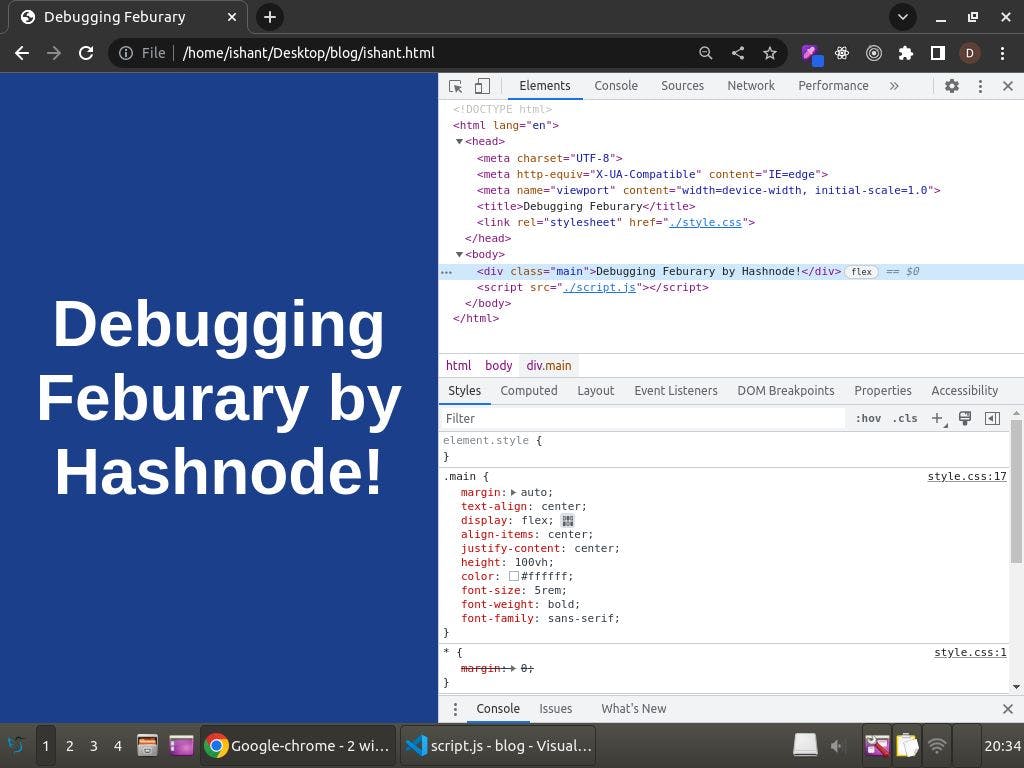
Open any website on a chrome browser. Then press Ctrl + Shift + I and the chrome developer tools will open. Using these tools, you can find and fix most of your web application bugs related to Design, Responsiveness, API calls, slow loading, memory leaks etc
In the above image, you can see that on the top right side, there are many tabs like Elements, Console, Sources etc inside the developer tools. These tabs are explained below!
Elements Tab
This tab is used to analyse all the HTML elements like texts, hyperlinks, images, forms, divs etc on your web page.
Under this tab, you will see the HTML code of your web page. Whenever you click on any HTML tag, you will be able to see all the CSS properties of that element under the Styles tab (See tabs at the middle right side in the above image). You can use this to figure out the cause of UI styling or alignment-related bugs!
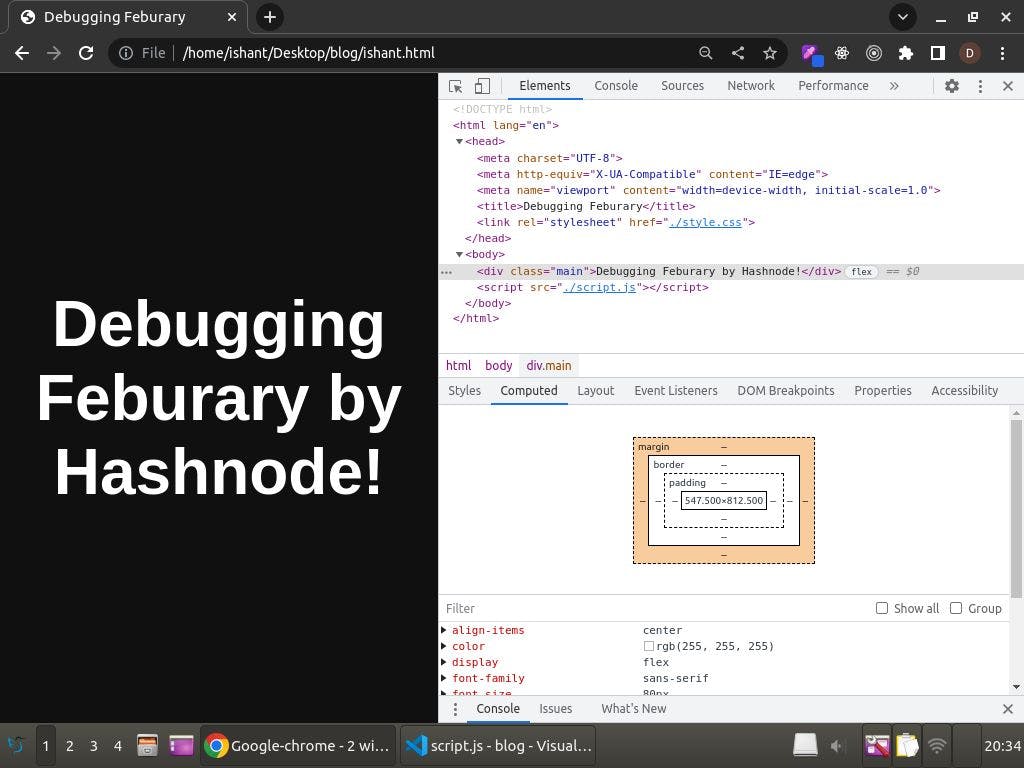
Under the Computed tab, you can see a graphical box model of the HTML element you clicked. This represents the padding and margin belonging to that element. Use this to debug any unwanted spacing-related bugs
Under the Event Listeners tab, you can see all the javascript event listeners like onClick() and onScroll() that are linked with your HTML element
You can use the Elements tab along with the Layout Inspector and Responsive Controls to debug your HTML and CSS code!
Console Tab
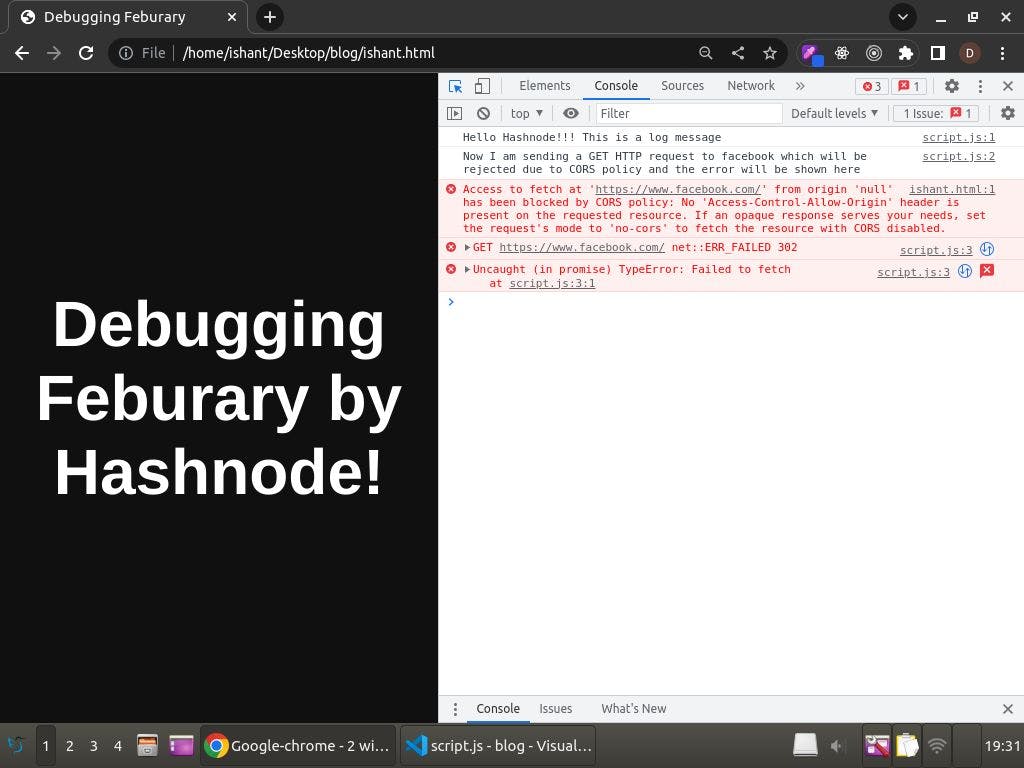
This tab is like a javascript terminal. Whenever you write any console.log() message, you can see the output in this section. Moreover, any errors or warnings caused by your web application will be shown here. In the above example, you can see 2 log messages and a CORS error. The code for the same will be:
<!DOCTYPE html>
<html>
<body>
<script>
console.log("Hello Hashnode!!! This is a log message");
console.log("Now I am sending a GET HTTP request to facebook which will be rejected due to CORS policy and the error will be shown here")
fetch("https://www.facebook.com", { method: "GET" });
</script>
</body>
</html>
Save this file as test.html, and open it in the Chrome browser. Then press Ctrl+Shift+I and navigate to the Console tab to see the output!
You can make use of the console tab to debug the javascript code!
Sources Tab
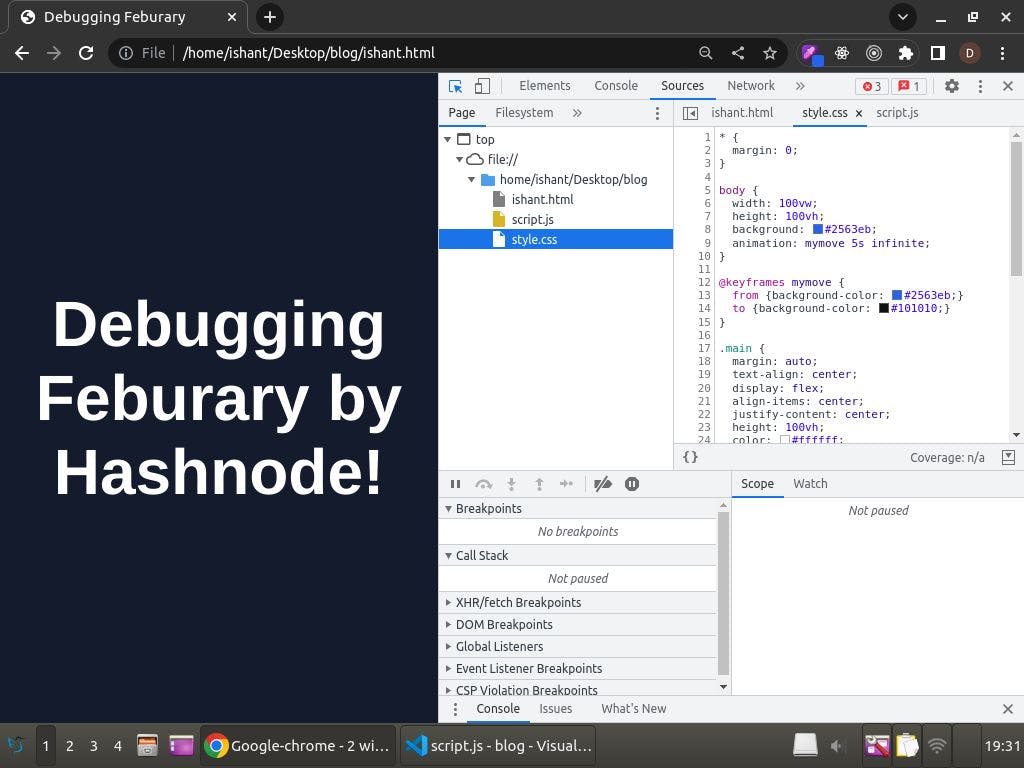
This tab contains a list of all the source files that your website is making use of such as stylesheets, scripts, images etc. Use this tab if you think your resources like CDN or other file imports are not working
Network Tab
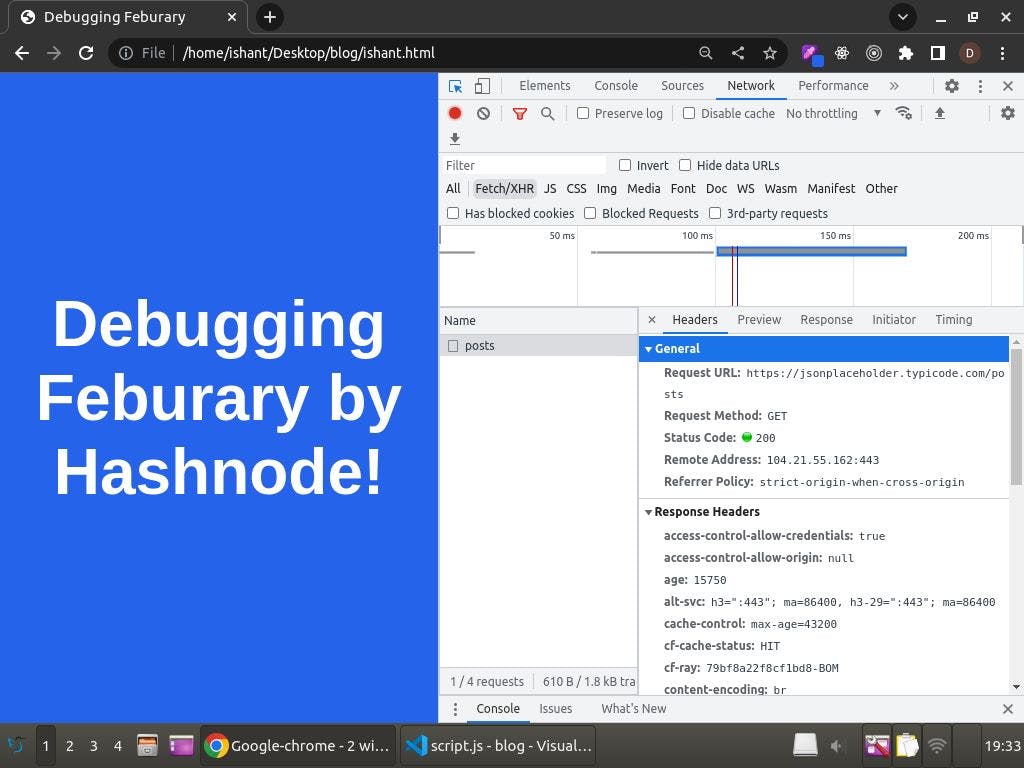
This tab is very useful when it comes to debugging API or network calls on a website. In this tab, you can analyse all the API requests sent from your web page, the headers and data they contained, the response and cookies received, processing time and lots of other things
To demonstrate this tab, write the following code in an HTML file and open it in the browser:
<!DOCTYPE html>
<html>
<body>
<script>
fetch("https://jsonplaceholder.typicode.com/posts", { method: "GET" });
</script>
</body>
</html>
In the above code, the fetch() function is a javascript function used to make network calls to a website. jsonplaceholder.typicode.com is a website that will return a dummy list of posts in JSON format. Once you open this webpage in the browser, open chrome developer tools, navigate to the network tab and in the middle right section of tabs, click on preview.
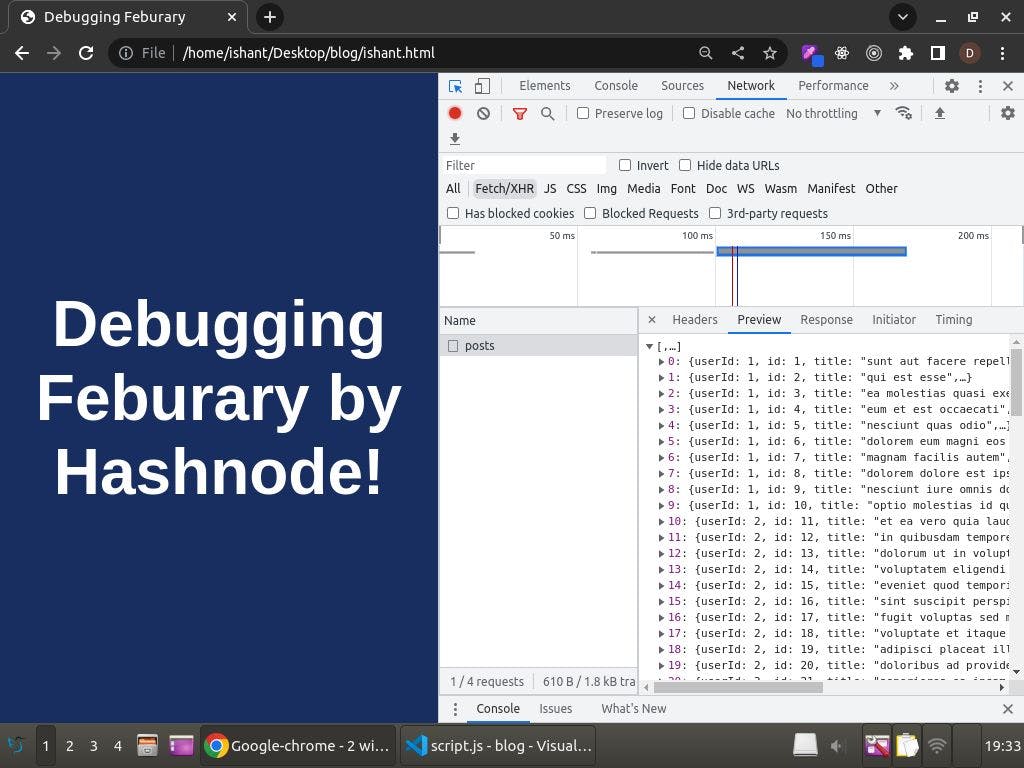
You will see the JSON response received from that website after making the GET request using the fetch() function
Performance Tab
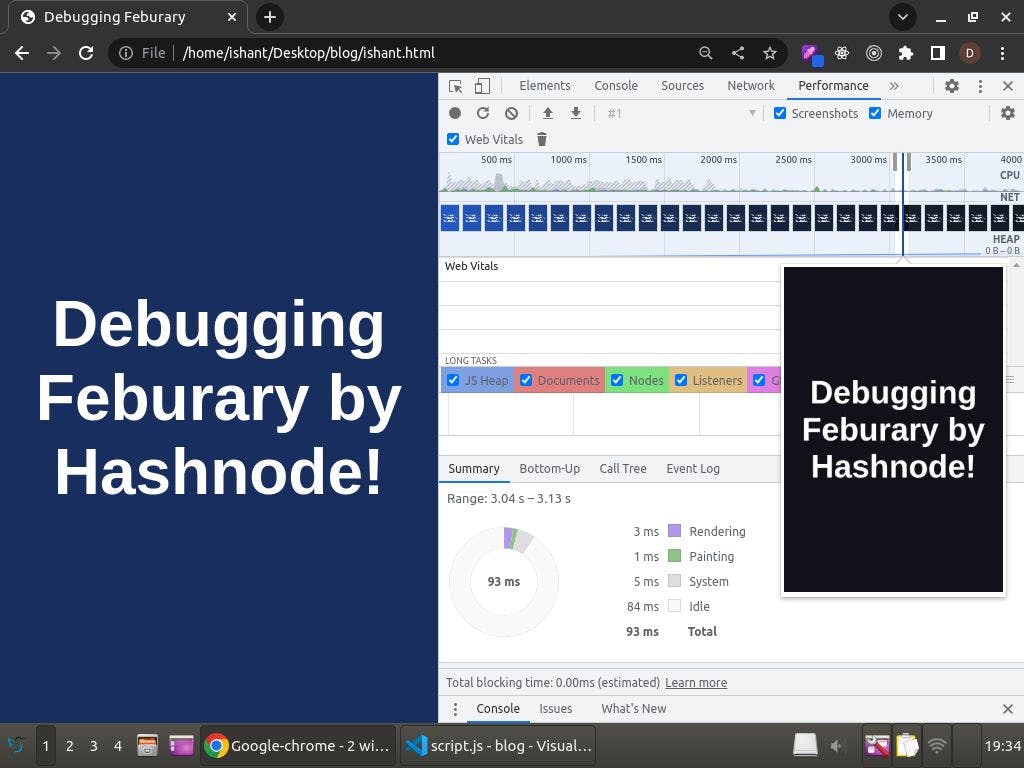
This tab is used to monitor and improve the performance of web pages with multiple layouts, network calls, computations etc. This type is like a screen recorder. Click on the start recording button, do some tasks like filling out an input form and then stop the recording. Then this tab will show the speed of rendering of layouts at each interval in the form of graphical charts!
Memory Tab
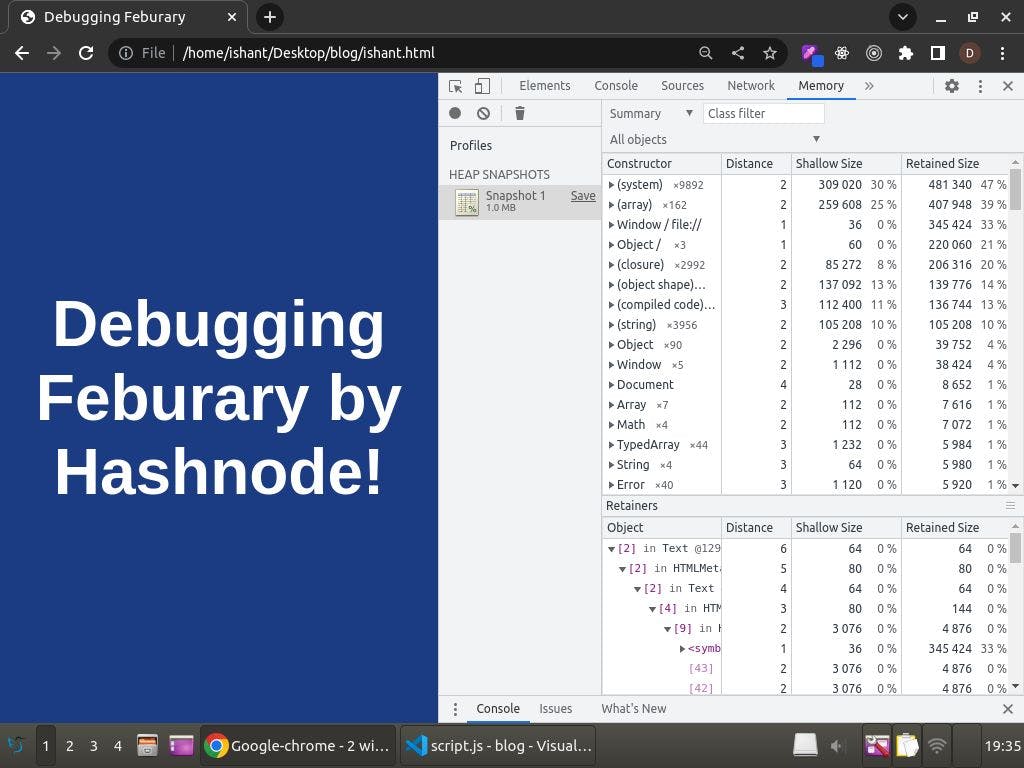
This tab is very useful in debugging memory leaks. A memory leak happens when your program creates a memory in heap but forgets to delete it. This results in high consumption of system resources and eventually leads to the website not responding. If you want to know how memory leaks work, try the following code:
<!DOCTYPE html>
<html>
<body>
<a href="https://www.hashnode.com">Open Hashnode Website</a>
<script>
Object.defineProperty(globalThis, Symbol(), {value: new Uint8Array(1<<20).slice(), writable: false, configurable: false})
</script>
</body>
</html>
Save this file as test.html and open it. This code will result in a 1 Mb memory leak. Your webpage will not respond and the only way to free that memory will be to close the tab.
Just like this, many times you will encounter memory leaks when making complex web apps. You can use the memory tab of developer tools to deal with such bugs!
Application Tab
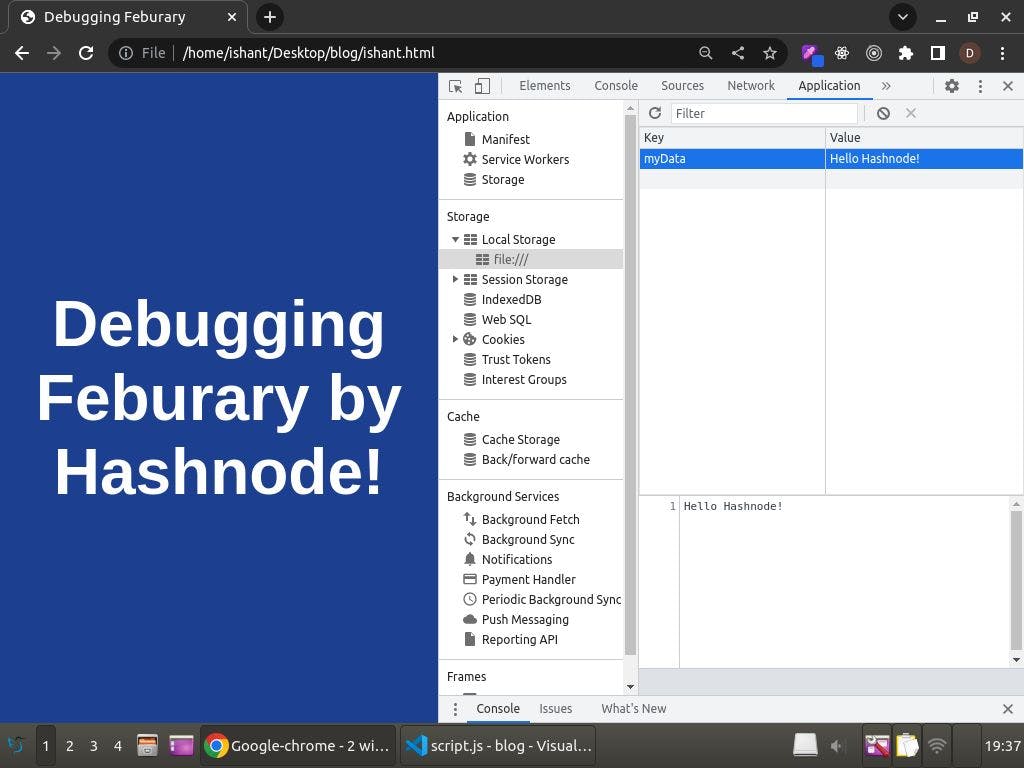
This tab contains session records, cookies and other storage data generated by your web application. In case you don't know, websites make use of sessions and cookies to store a user's authentication details and let him stay logged in. Data can be stored in a browser either in a cookie or local storage. To demonstrate this, see the code below:
<!DOCTYPE html>
<html>
<body>
<script>
localStorage.setItem('myData','Hello Hashnode!');
</script>
</body>
</html>
This code will save the text data in the local storage of your browser. You can make use of the application tab to debug refresh tokens and other storage-related bugs!
You can also find similar tools in Mozilla Firefox, Safari and other popular browsers too!
#2 VSCode Debugging Extensions ⚒
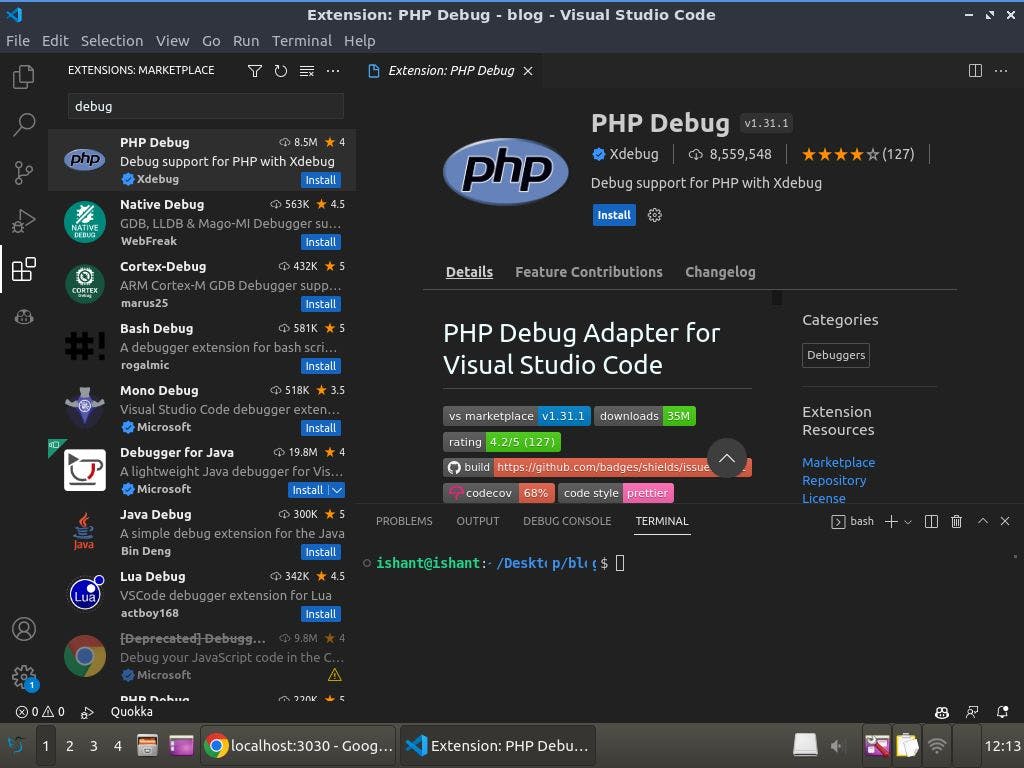
Chrome Developer tools were used to understand how your web app behaves in terms of design, data fetching and performance. However, to understand the tiny details of how your code works and debug some minute errors, you need a debugger!
VSCode is one of the most popular code editors for web developers. It comes with an inbuilt debugger for NodeJs however you can also install debuggers for other languages like Java, PHP, Python etc using the VSCode marketplace as shown in the above image
Using the debugger tool, you can analyse the flow of your code. You can pause the execution of code in between, watch the values contained by different variables at that moment, and do a lot more!
To demonstrate how a debugger works, look at the following code:
const express = require("express");
const app = express();

app.get("/", (req, res) => {
  res.send("Hello World");
});

app.listen(3030, () => console.log("Server running on port 3030"));
You don't need to understand this code if you aren't familiar with javascript. Just know that it is a simple ExpressJs API. Whenever a user opens localhost:3000/home in his browser's URL bar, he will see a Hello World text on the screen
The app.get() function specifies that we need to respond to a GET request. (req, res) are the request and response parameters. So in this code, whenever we get a GET request on /home endpoint of localhost:3030, we will send a response with the text Hello World
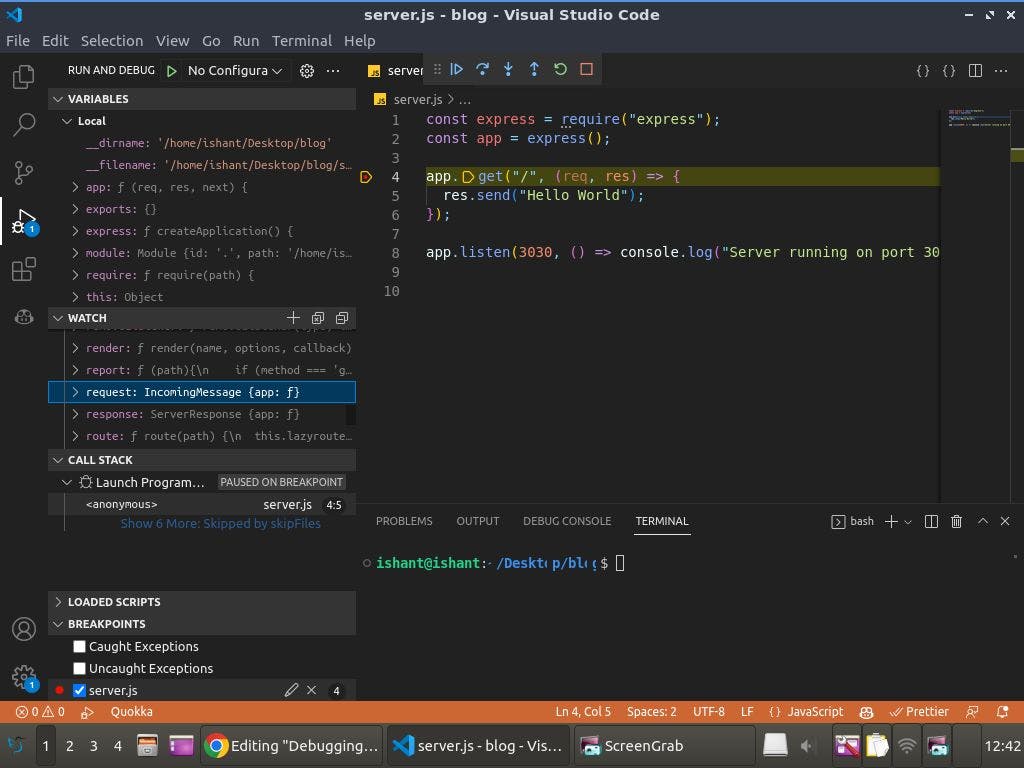
Now see how this code is debugged. Suppose you are facing some bugs like the response is not sending properly or request query parameters are missing, simply click on the line number of app.get() i.e 4th line. You will see a red dot there.
This red dot is called a breakpoint. Whenever you will run a debugger, the execution of code will pause at this breakpoint and you will be able to see the values contained by different variables like the const app variable's data as shown on the left section under the VARIABLES and WATCH tab!
You can use the same approach to work with other debuggers for Java and Python languages!
#3 OWASP ZAP 🔐
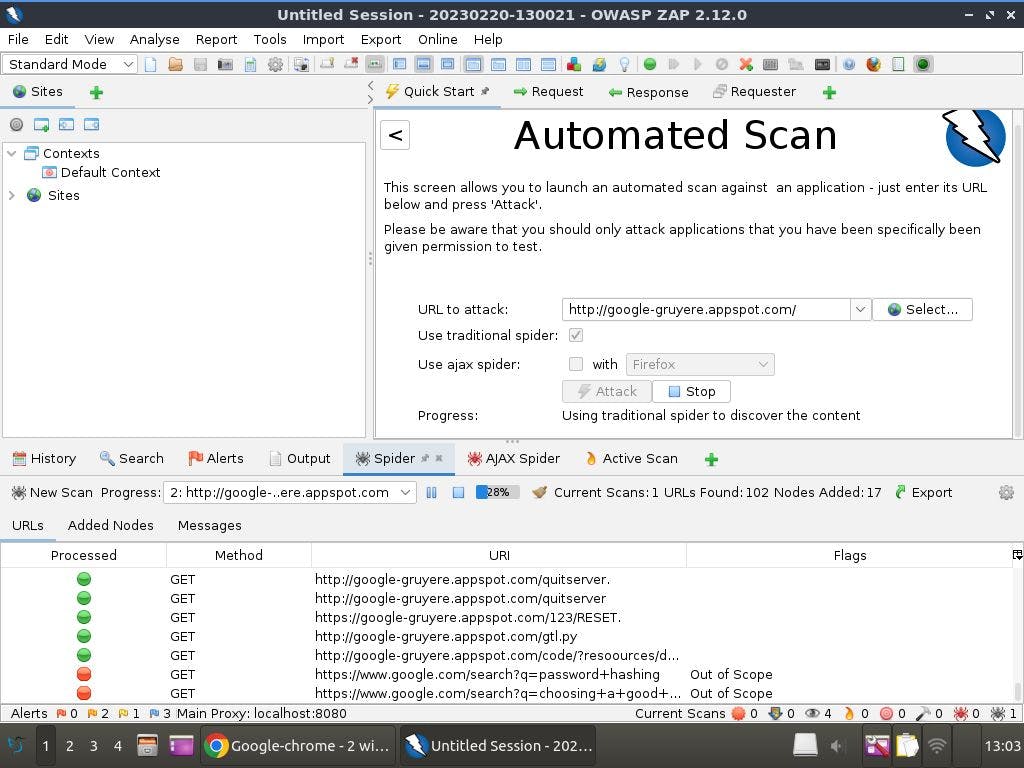
This tool is an excellent tool for finding security-related bugs in a web application. Simply open the OWASP ZAP tool, enter the URL of your web application and run an automated scan
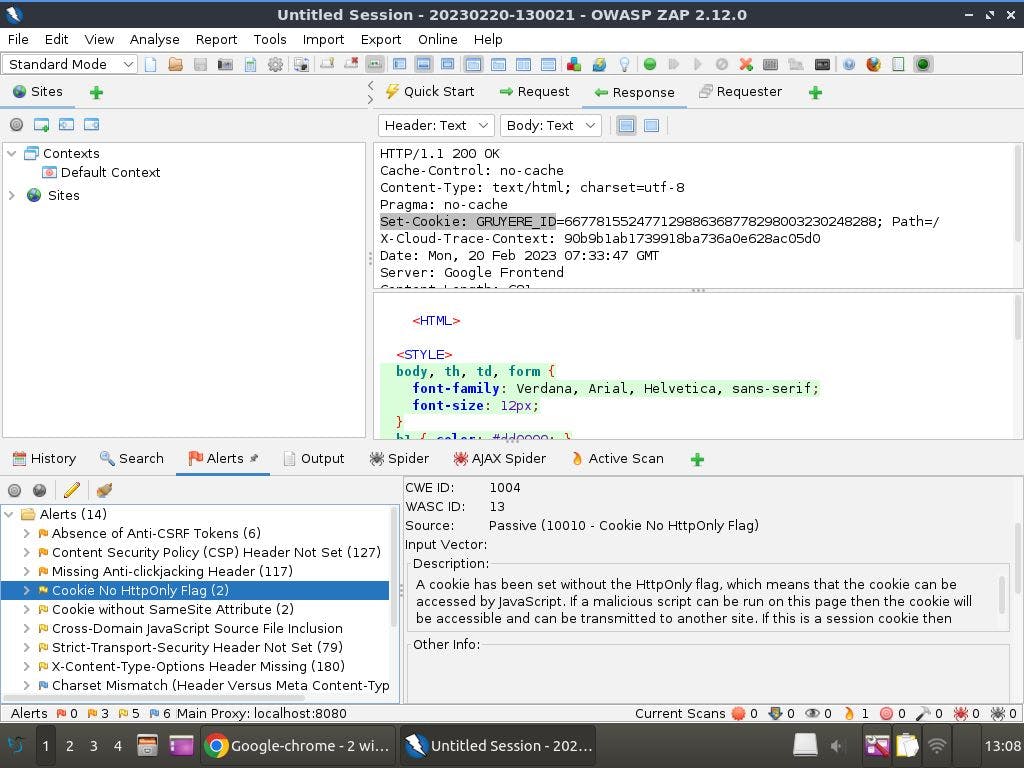
This tool will crawl throughout all the web pages of the website and at the end of the scan, you will be able to see all the security vulnerabilities under the Alerts tab as shown in the above image (See bottom left section). Using this tool, you can fix all security-related bugs to prevent your website from getting hacked.
Also, remember that performing security attacks on a website without the explicit permission of its owner can result in legal issues. So it is better if you use this tool on your website, or make use of websites like "https://google-gruyere.appspot.com/" or "http://www.itsecgames.com/" that have been specifically created to practice exploitation attacks
Writing test cases to prevent or fix bugs 💡
Testing is the process of ensuring that your code behaves as expected. In testing, you write test cases that determine if your code gives the expected results or not.
Testing itself is a vast subject. There are dozens of different tests like unit tests, integration tests etc. Unit testing is the simplest type of software testing. A unit means any function or a small group of lines of code in the software. In unit testing, you write test cases for all the units to ensure whether they give desired results or not.
Writing these test cases differ from language to language. Therefore, explaining everything is not possible in a single article. However, for giving a quick demonstration, I will make use of a very basic NodeJs application to demonstrate how testing works!
Remember that testing is an advanced concept. So if you are not able to understand the following code, don't worry. My goal is not to teach testing but to give an idea of how test cases are written in computer programming. If you don't know NodeJs, you can still follow through with this section!
Testing a NodeJs Application
To test a NodeJs application, we have many different choices for testing frameworks like
Jest
Mocha
Jasmine
In this article, I will make use of Jest which is a testing framework created by Facebook. It is really easy to use as a beginner. First, you need to create a NodeJs project. For this, download NodeJs from its official website.
Then create a folder "Testing", open VSCode there and in the terminal, write:
npm init
npm install jest
Using npm init, we initialize a NodeJs project and using npm install jest, we install the Jest framework
You will see a folder named node_modules and a file named package.json in the file explorer. Don't worry, I will explain everything below. For now, open the package.json file and change its code to:
{
  "name": "testing",
  "version": "1.0.0",
  "description": "",
  "main": "index.js",
  "scripts": {
    "test": "jest"
  },
  "author": "",
  "license": "ISC",
  "dependencies": {
    "jest": "^29.4.3"
  }
}
You are now ready to write your first test case! We will create a simple test case that checks if we are adding and subtracting 2 numbers correctly or not
To use the jest framework, create a folder named "__tests__". There create a file named myTest.js and write:
describe("Testing with Jest", () => {
  test("Addition", () => {
    const sum = 7 + 27;
    const expectedResult = 34;
    expect(sum).toEqual(expectedResult);
  });
  test("Subtraction", () => {
    const sum = 27 - 7;
    const expectedResult = 20;
    expect(sum).toEqual(expectedResult);
  });
});
And now to launch the testing, in the terminal write:
npm run test
And you will see the output below image:
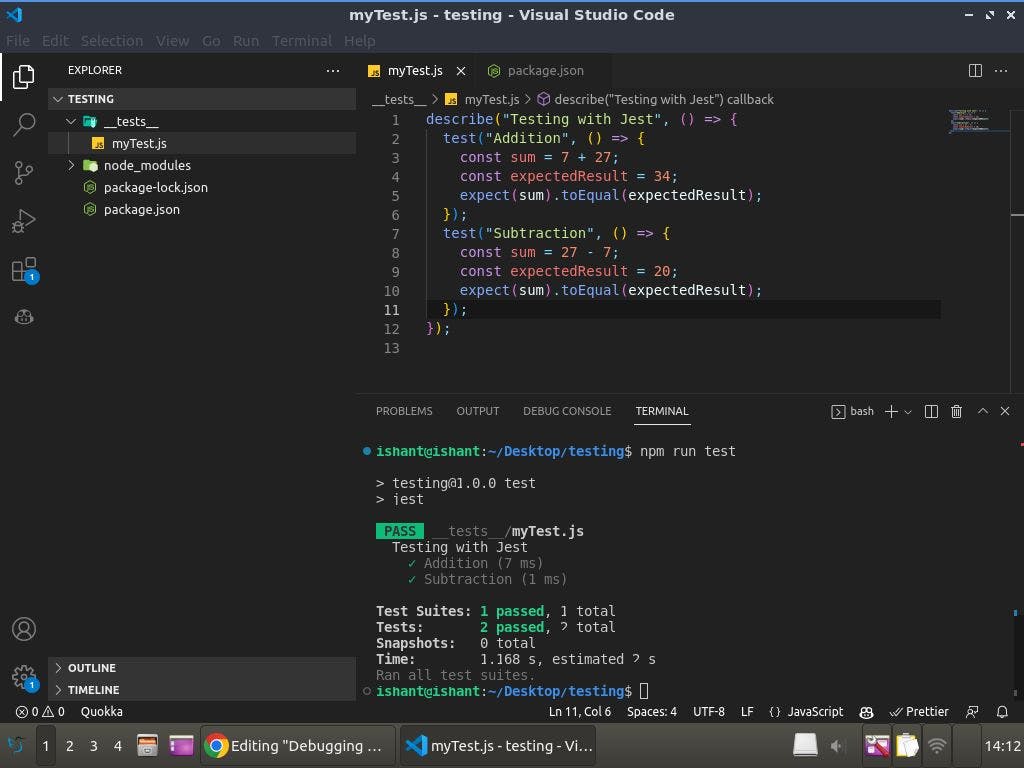
Congratulations! You just wrote your first test case! Now let's understand what happened throughout the process:
When you wrote the npm init command in the terminal, a NodeJs project was initialized inside the testing folder. A file called package.json was generated along with the node_modules folder
package.json contains a list of all the libraries your node project will use whereas the node_modules folder will contain the actual installed library's code
For instance, when you wrote the npm install jest command, you can see Jest being added in the package.json file and the Jest folder being downloaded inside the node_modules folder
myTest.js is a file that contains all the test cases. When using the jest framework, we need to place all our test cases files inside a "__tests__" folder
In myTests.js, we have 4 functions provided by Jest which are describe(), test(), expect() and toEqual()
describe() simply describes a name for the collection of features you are testing and contains all the unit tests whereas the test() function takes the name of the unit test and the actual unit function to be tested
expect() is the actual unit testing function where we pass a variable and expect it to be equal to the variable inside toEqual() function
Finally, when we write the npm run test command in the terminal, we see the results of the test cases
This was just an introduction to how test cases are written. There is a lot in the Jest framework. When making large projects, if you regularly test your code, trust me you will prevent a lot of potential bugs!
Testing other common frameworks
For different frameworks like ReactJs, Django, PHP etc, we have other frameworks that you can explore as per your needs:
| Language / Framework | Testing Framework |
| ReactJs | Jest, Cypress |
| PHP | PHPUnit |
| Python | Selenium |
| Django | Pytest or Unittest |
| Java / Kotlin | JUnit |
| Go | Ginkgo |
BONUS: Debugging for Android App Developers! 😋
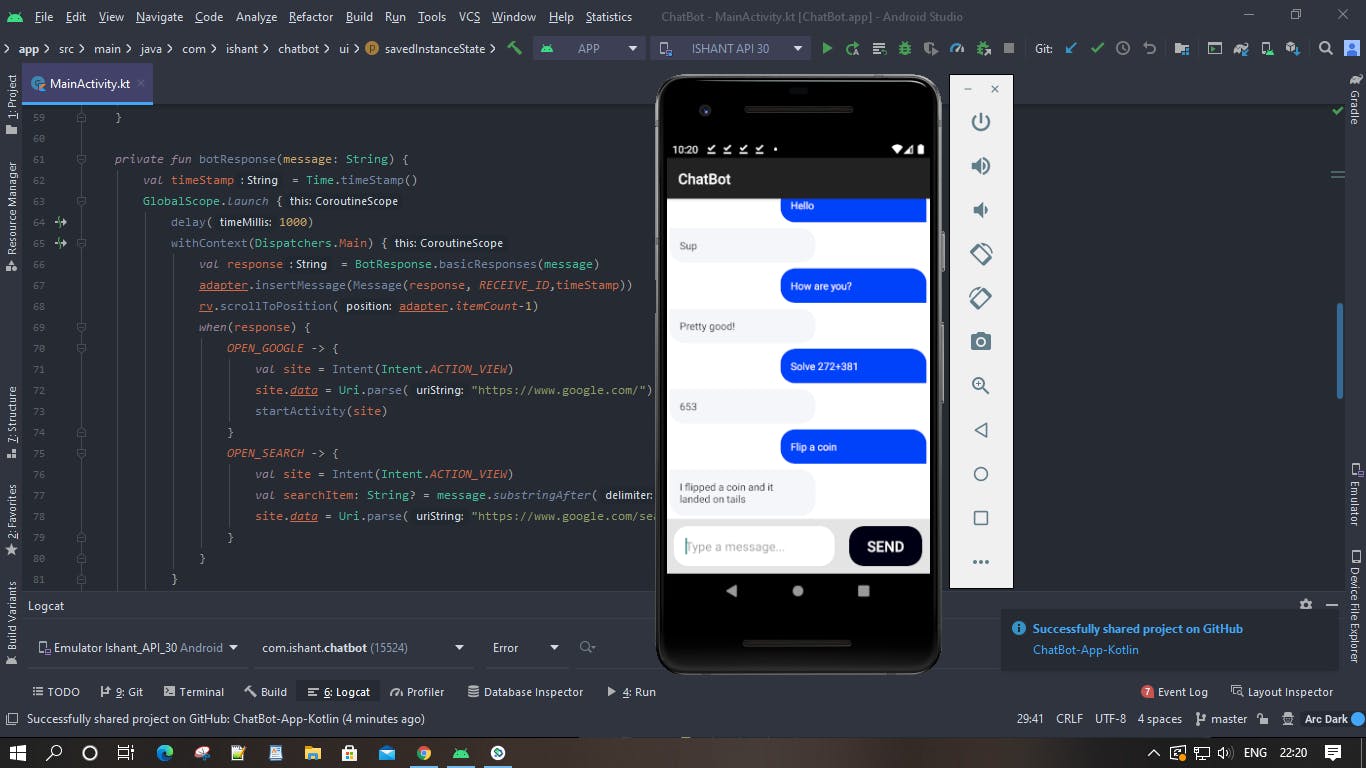
Debugging in android apps is itself another vast subject and due to the increasing length of this article, it is not possible to explain everything. However, I wanted to share some debugging approaches I frequently make use of to deal with some annoying bugs when creating android apps!
Debugging an android app is quite similar to how we debug a web app. In the above image, at the bottom, you can see the Logcat tab. Just like in javascript, we see all the console.log() messages and errors in the Console tab of the browser, in the android terminal tab we can see all the Log.d() debug messages, errors and warnings generated by our code.
Similarly, we have a Build tab to see build-related errors, a Profiler tab to debug performance-related issues, and an Android Debugger tool to analyse the flow of code in our app
Common Bugs When Making Android Apps
Now, I want to share some common bugs faced by android developers along with their solutions!
#1 App keeps on crashing
If your app keeps on crashing,
Make sure you have imported functions from the right class as there are many classes with the same name in Android SDK
If you are using third-party libraries from GitHub, ensure you have properly configured the build.gradle files
Try searching for the issue in the GitHub repository's issues section or try using some other third-party library
Most of the time, a library that worked with an older gradle version may not work with a newer gradle version. So try upgrading or downgrading your library or gradle version
#2 Slow UI performance
If your app's animations lag or fragment/activity transitions take place slowly,
If animation lags inside a fragment / bottom sheet/ dialog box, create the animation object in activity and simply reuse that object wherever you need rather than creating an animation object whenever required
Avoid displaying many animations in fragments with lots of scrollable views. Use activities instead
Try implementing the animation part in another blank project to see if lag is caused by animation or any other part of your actual project
#3 App mysteriously restarting
If your app suddenly restarts when you are working with it, it is known as a silent crash. Silent crashes occur because the compiler does not know what exception to throw and hence it simply kills and restarts the app. For this,
Sometimes silent crashes only occur when you are using ADB so disconnect your app from ADB and then test your app
Some third-party libraries also cause silent crashes so you need to look for them too
Too many nested views, overlays and animations may cause some touch or gesture issues that may result in a silent crash
Summary 🍧
Debugging is the process of finding and fixing bugs in software. To debug your code, you can make use of StackOverflow, GitHub issues and other sites on the internet. If this doesn't work, try some generic solutions like clearing the cache or reinstalling project files. You can also comment down certain sections of your code and then execute it to find the location of the bug.
If nothing above works, you can make use of certain debugging tools. We have Chrome developer tools that can help you debug pretty much everything related to your website layout, responsive behaviour, network calls and memory leaks. You can use the VSCode's debugger to monitor the flow of your code and detect changes in the values of variables during execution. When it comes to security in web apps, you can use an open-source tool called OWASP ZAP to detect all security vulnerabilities Additionally, you can write test cases in web apps to ensure you won't encounter any serious bugs later.
Debugging in android is similar to the web as we have the Debugger, Logcat, Profiler etc. Some common android bugs include crashing the app, slow performance, and the app mysteriously restarting which can be easily fixed using the debugging strategies and tools I have talked about in this article!
Resources 🔗
These are some resources you can use to master all the things I've discussed in this article
What's Next? 📒
If you are interested in knowing one of my debugging adventures, you can check out the second part of this article where I have discussed how I dealt with some annoying bugs when creating a full stack project called SpaceFeed. Along with this, I have also shared some mechanisms you can implement to detect any bugs in production :)
Link to part 2 of this article: https://ishantchauhan.hashnode.dev/my-debugging-adventure-fixing-bugs-in-spacefeed
Thanks 😇
I would like to thank Hashnode for providing such an awesome platform to share your thoughts and ideas. I hope this article will help the readers in understanding how one can debug even the most difficult bugs in computer programming. If you have any questions, let me know in the comment section or drop me a message on my instagram or linkedin :)